
Welcome to the SaaS VC Report 2026, SaasRise's annual deep dive into the state of venture capital for software and SaaS companies worldwide. This report covers full-year 2025 data with Q1 2026 updates, analyzing investment trends, valuations, top VC firms, geographic distribution, and what it all means for founders and investors.
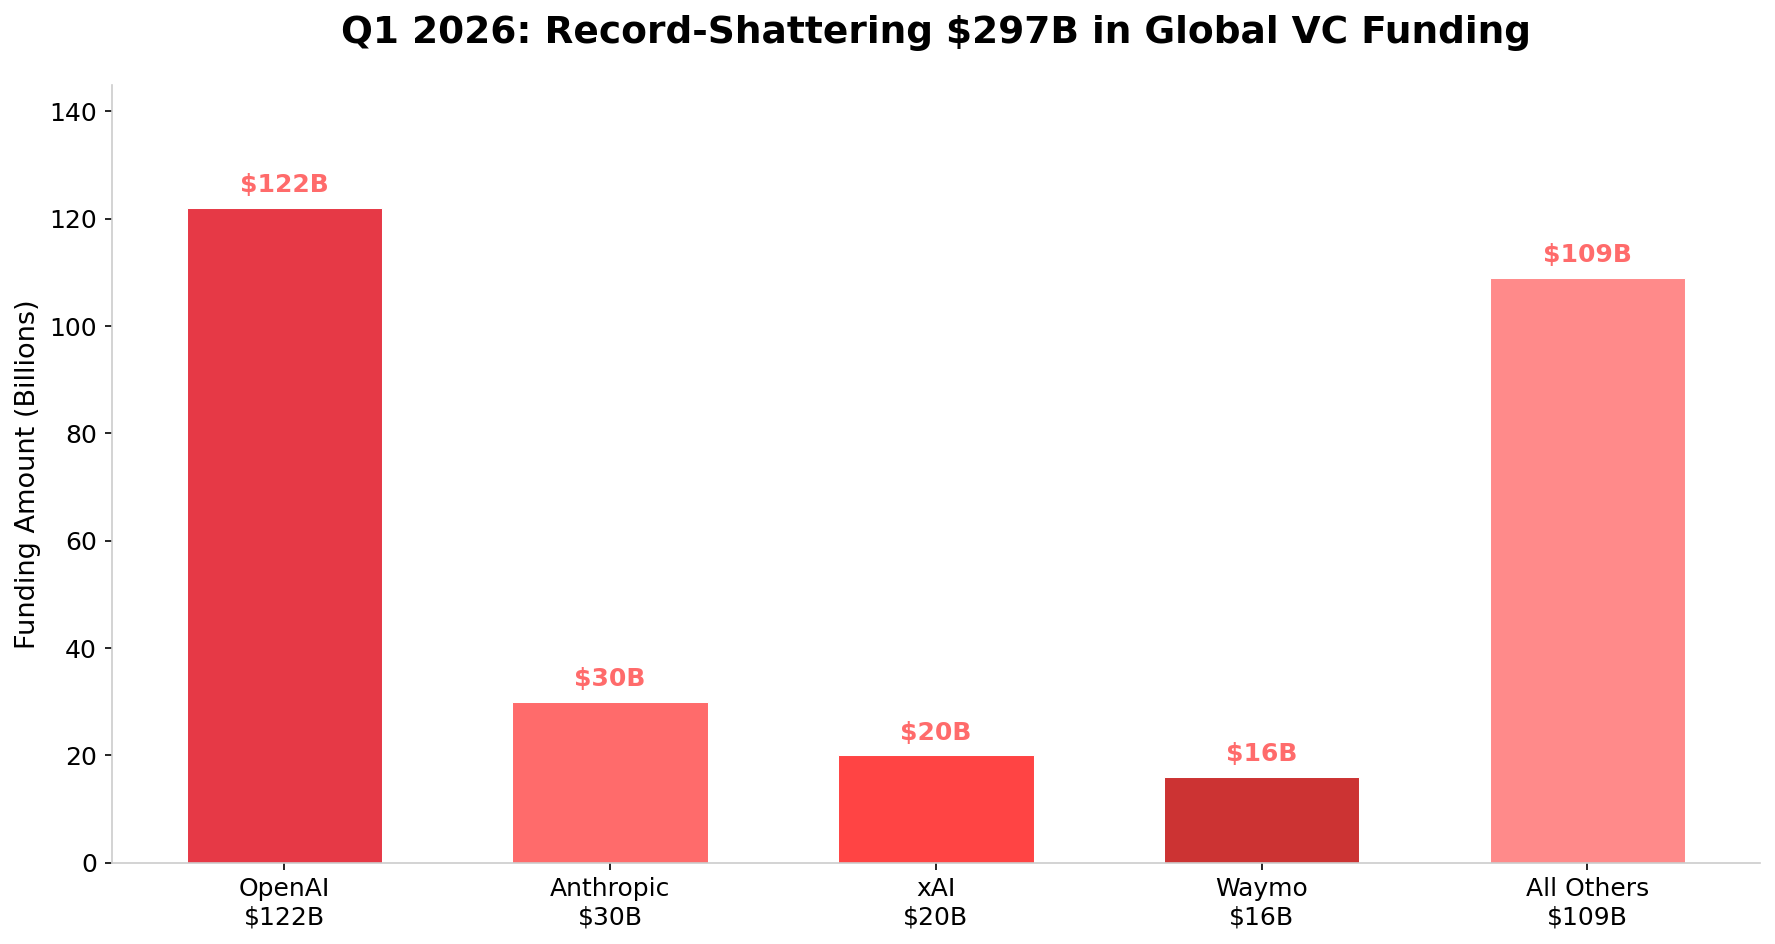
2025 was a year of extremes. Global venture capital hit $512 billion in deal value — the second-highest annual total ever — driven almost entirely by artificial intelligence. AI companies captured more than half of all VC deal value globally, reshaping the venture landscape in ways not seen since the dot-com era. Meanwhile, Q1 2026 shattered all records with $297 billion in a single quarter, fueled by unprecedented mega-rounds from OpenAI, Anthropic, xAI, and Waymo.
Yet beneath the headline numbers lies a deeply bifurcated market: a small number of AI-powered companies are absorbing the majority of capital, while traditional SaaS companies face compression in multiples and increased scrutiny from investors demanding profitability and efficiency. This report unpacks the full picture.
If you like this type of data-driven SaaS content and want weekly masterminds with other experienced SaaS CEOs and founders, apply here to join the SaasRise community.
📋 Table of Contents
- Key SaaS Venture Capital Stats
- The 2026 SaaS VC Rankings
- Top 20 SaaS VC Firms by Investment Count, Exits, and AUM
- Top 25 SaaS VC Power Rankings
- The AI Dominance of VC
- SaaS VC Deals By Year
- SaaS VC Dollars Invested By Year
- SaaS VC Invested By Round By Year
- How Software Valuations Have Changed
- SaaS VC Deal Valuations By Round By Year
- SaaS VC Deal Revenue Multiples
- Public SaaS Multiples Under Pressure
- Hot SaaS Sectors for VC in 2026
- The Best Locations for Software VC
- Top Regional Software VCs
- Q1 2026: The Quarter That Broke Records
- SaaS VC Outlook for 2026 and Beyond
Key SaaS Venture Capital Stats
Here are the key statistics for the software venture capital market in 2025:
The 2026 SaaS VC Rankings
Top 20 SaaS VC Firms — Investments, Exits, and AUM
| Rank | Firm | Software Investments |
|---|---|---|
| 1 | Accel | 2,050 |
| 2 | Sequoia Capital | 2,010 |
| 3 | Andreessen Horowitz | 1,780 |
| 4 | Enterprise Ireland | 1,720 |
| 5 | Gaingels | 1,510 |
| 6 | New Enterprise Associates | 1,420 |
| 7 | Alumni Ventures | 1,390 |
| 8 | Right Side Capital Mgmt | 1,320 |
| 9 | FJ Labs | 1,290 |
| 10 | Antler | 1,270 |
| 11 | Bessemer Venture Partners | 1,240 |
| 12 | Lightspeed Venture Partners | 1,210 |
| 13 | General Catalyst | 1,185 |
| 14 | SV Angel | 1,140 |
| 15 | Kima Ventures | 1,120 |
| 16 | Kleiner Perkins | 1,115 |
| 17 | Tiger Global Management | 1,090 |
| 18 | SOSV | 1,070 |
| 19 | Index Ventures | 1,030 |
| 20 | Soma Capital | 990 |
| Rank | Firm | Software Exits |
|---|---|---|
| 1 | SV Angel | 585 |
| 2 | Right Side Capital Mgmt | 545 |
| 3 | Accel | 540 |
| 4 | Sequoia Capital | 535 |
| 5 | New Enterprise Associates | 520 |
| 6 | Enterprise Ireland | 465 |
| 7 | Greylock | 410 |
| 8 | Kleiner Perkins | 400 |
| 9 | Kima Ventures | 395 |
| 10 | Bessemer Venture Partners | 385 |
| 11 | Andreessen Horowitz | 355 |
| 12 | Lightspeed Venture Partners | 340 |
| 13 | Internet Initiatives Dev. | 295 |
| 14 | Index Ventures | 290 |
| 15 | General Catalyst | 285 |
| 16 | Gaingels | 275 |
| 17 | First Round Capital | 270 |
| 18 | SOSV | 268 |
| 19 | FJ Labs | 265 |
| 20 | Bossa Invest | 255 |
| Rank | Firm | AUM (Millions) |
|---|---|---|
| 1 | Sequoia Capital | 90,000 |
| 2 | Shenzhen Capital Group | 68,000 |
| 3 | Tiger Global Mgmt | 58,000 |
| 4 | HongShan Capital Group | 57,000 |
| 5 | Andreessen Horowitz | 45,000 |
| 6 | General Catalyst | 35,000 |
| 7 | New Enterprise Associates | 27,500 |
| 8 | Lightspeed Venture Partners | 26,500 |
| 9 | IDG Capital | 24,500 |
| 10 | TCV | 22,500 |
| 11 | KB Investment | 21,500 |
| 12 | Kleiner Perkins | 21,000 |
| 13 | Bessemer Venture Partners | 19,500 |
| 14 | Thrive Capital | 18,000 |
| 15 | Norwest Venture Partners | 16,500 |
| 16 | Khosla Ventures | 16,000 |
| 17 | Ribbit Capital | 13,500 |
| 18 | Founders Fund | 13,000 |
| 19 | Bain Capital Ventures | 11,500 |
| 20 | Sapphire Ventures | 11,000 |
The Top 20 SaaS VC Firms By Investments, Exits, and AUM
The 2026 SaaS VC Power Rankings
If we give equal 33% weighting to software investment count, 33% weighting to AUM, and 33% weighting to number of software exits to create a Software VC Power Ranking, the top 25 list becomes:
| Power Rank |
Investor | City | Country | Last Investment Type |
Software Exits |
Software Investments |
AUM (Millions) |
Overall Power Ranking |
|---|---|---|---|---|---|---|---|---|
| 1 | Sequoia Capital | Menlo Park | United States | Later Stage VC | 535 | 2,010 | 90,000 | 1,015,420 |
| 2 | Andreessen Horowitz | Menlo Park | United States | Early Stage VC | 355 | 1,780 | 45,000 | 302,510 |
| 3 | New Enterprise Associates | Menlo Park | United States | Early Stage VC | 520 | 1,420 | 27,500 | 228,150 |
| 4 | Tiger Global Management | New York | United States | Later Stage VC | 215 | 1,090 | 58,000 | 155,200 |
| 5 | General Catalyst | San Francisco | United States | Seed Round | 285 | 1,185 | 35,000 | 125,680 |
| 6 | Lightspeed Venture Partners | Menlo Park | United States | Later Stage VC | 340 | 1,210 | 26,500 | 118,250 |
| 7 | Kleiner Perkins | Menlo Park | United States | Later Stage VC | 400 | 1,115 | 21,000 | 102,340 |
| 8 | Bessemer Venture Partners | Redwood City | United States | Early Stage VC | 385 | 1,240 | 19,500 | 98,750 |
| 9 | HongShan Capital Group | Beijing | China | Early Stage VC | 140 | 920 | 57,000 | 82,600 |
| 10 | IDG Capital | Beijing | China | Early Stage VC | 230 | 850 | 24,500 | 52,850 |
| 11 | Norwest Venture Partners | Menlo Park | United States | Buyout/LBO | 248 | 780 | 16,500 | 35,320 |
| 12 | Khosla Ventures | Menlo Park | United States | Early Stage VC | 210 | 740 | 16,000 | 28,550 |
| 13 | Founders Fund | San Francisco | United States | Later Stage VC | 200 | 695 | 13,000 | 20,180 |
| 14 | TCV | Menlo Park | United States | Later Stage VC | 185 | 390 | 22,500 | 18,500 |
| 15 | Shenzhen Capital Group | Shenzhen | China | Early Stage VC | 65 | 340 | 68,000 | 16,300 |
| 16 | Thrive Capital | New York | United States | Later Stage VC | 95 | 425 | 18,000 | 15,800 |
| 17 | Bain Capital Ventures | San Francisco | United States | Early Stage VC | 185 | 660 | 11,500 | 15,280 |
| 18 | Index Ventures | San Francisco | United States | Later Stage VC | 290 | 1,030 | 4,500 | 14,250 |
| 19 | Redpoint Ventures | Woodside | United States | Early Stage VC | 215 | 620 | 8,000 | 12,100 |
| 20 | First Round Capital | San Francisco | United States | Later Stage VC | 270 | 810 | 3,500 | 8,450 |
| 21 | Entrepreneur First | London | United Kingdom | Seed Round | 170 | 650 | 4,200 | 7,650 |
| 22 | IVP | Menlo Park | United States | Later Stage VC | 185 | 405 | 9,200 | 7,450 |
| 23 | Canaan Partners | San Francisco | United States | Seed Round | 175 | 490 | 7,200 | 6,980 |
| 24 | Sapphire Ventures | Austin | United States | Early Stage VC | 148 | 420 | 11,000 | 6,820 |
| 25 | Peak XV Partners | Bengaluru | India | Later Stage VC | 95 | 700 | 9,500 | 6,720 |
Top SaaS VC Firms – Power Rankings
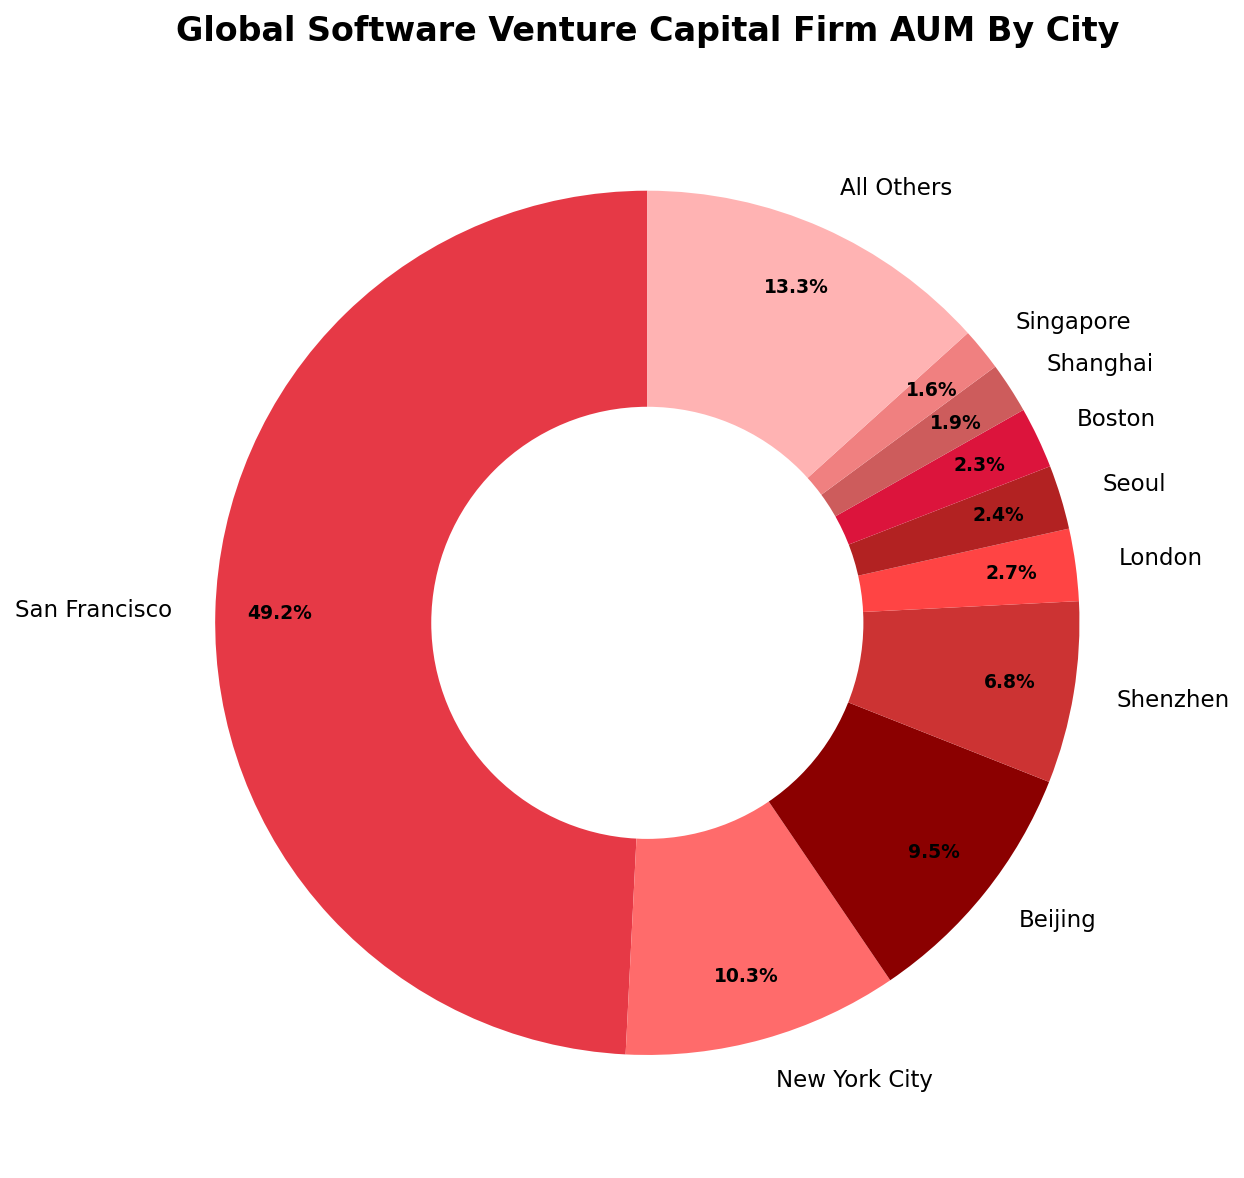
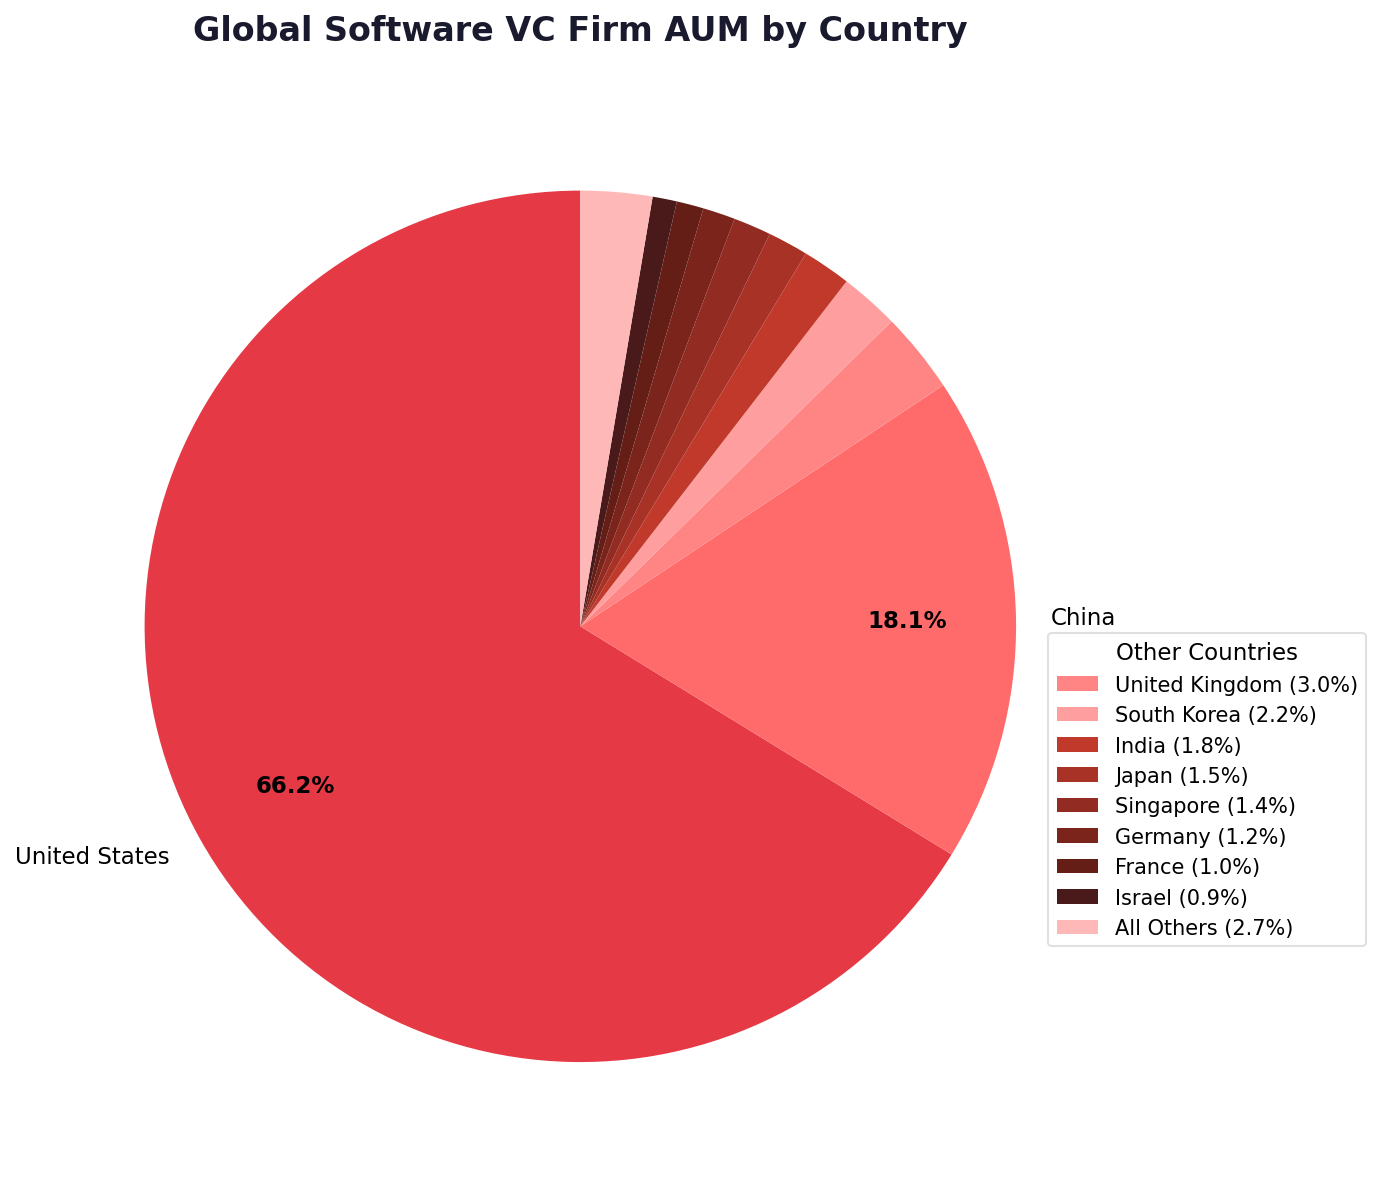
These 25 firms together control approximately $645 billion in AUM and have over $130B in dry powder. 18 of the top 25 firms are based in the San Francisco Bay Area, with 2 in New York, 2 in China, 1 in London, 1 in Austin, and 1 in Bangalore. Notably, Thrive Capital enters the top 25 for the first time at #16, driven by its aggressive AI investing strategy including major bets on OpenAI and other frontier AI companies.
The AI Dominance of Venture Capital
The defining story of 2025 wasn't just how much money was invested — it was where it went. Artificial intelligence has fundamentally reshaped the venture capital landscape, absorbing more than half of all global deal value for the first time in history.
Up from 30% in 2023 and just 10% in 2015
According to PitchBook-NVCA data, AI/ML deals captured 65.6% of all US VC deal value in 2025, totaling $222 billion out of $339.4 billion. That's a staggering concentration: 50% of the total US deal value was invested in just 0.05% of completed deals. The top deals — OpenAI's $40 billion round, Databricks at $4 billion, Anthropic's $13 billion, and xAI's $10 billion — collectively accounted for the majority of capital deployed.
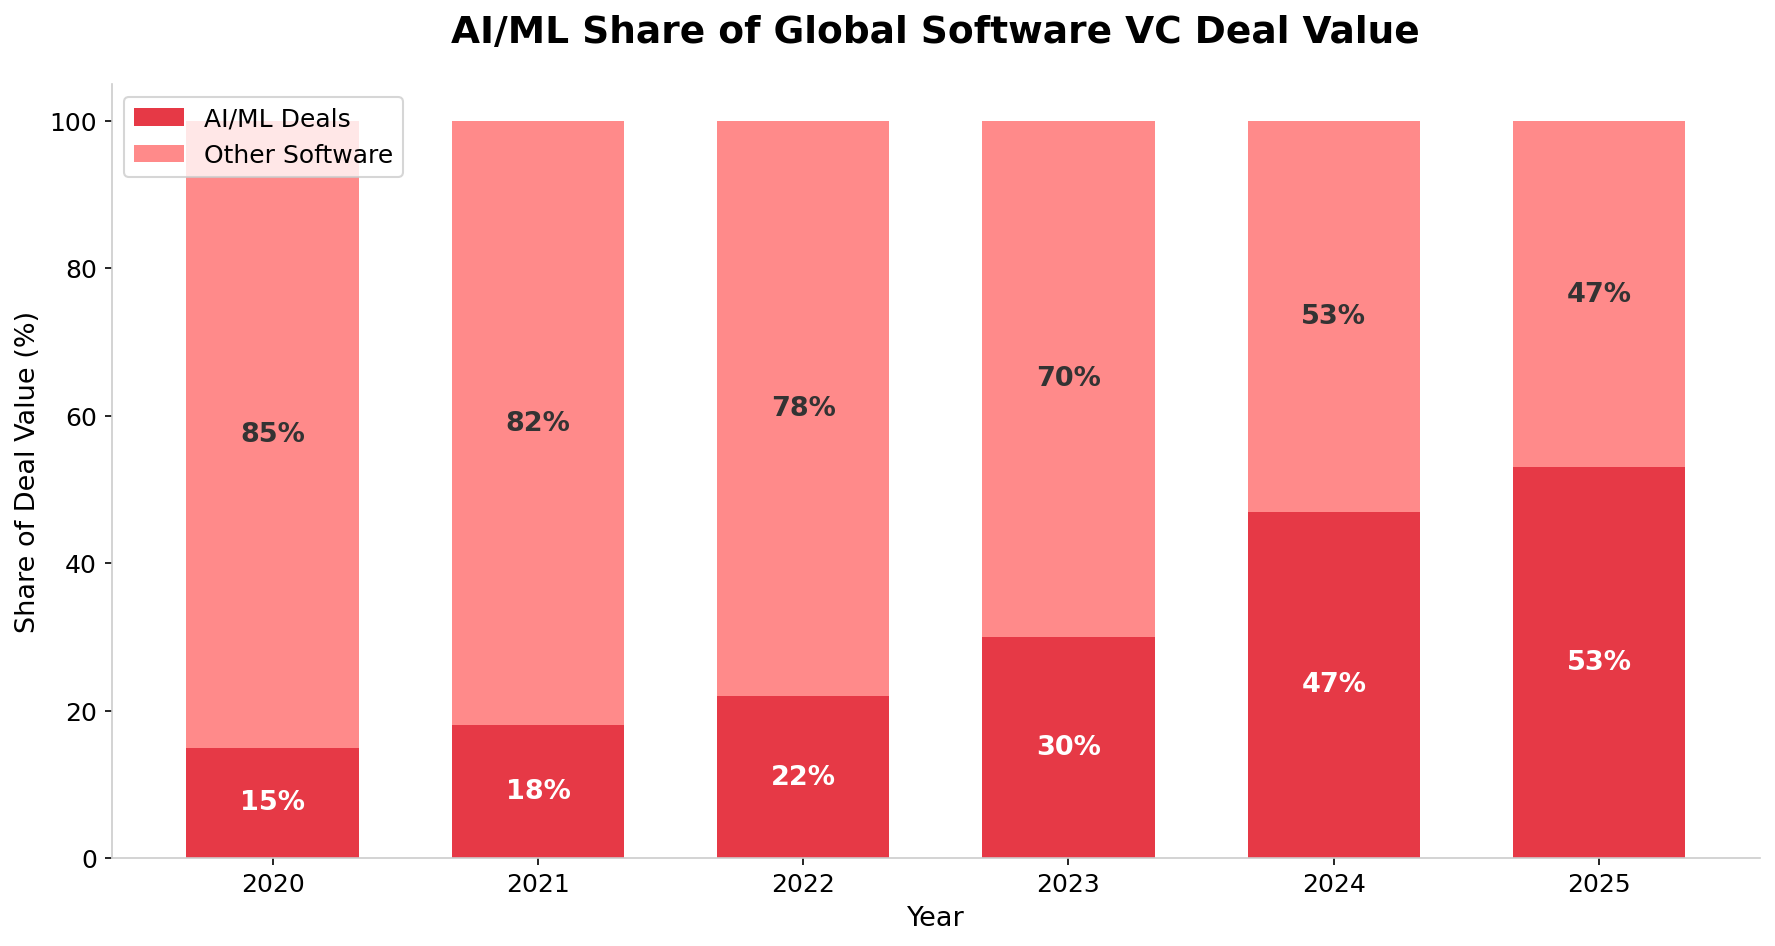
AI/ML Share of Global Software VC Deal Value
Since the launch of ChatGPT in late 2022, AI investment has grown from $73 billion in 2022 to $222 billion in 2025 in the US alone — a 204% increase in just three years with a 24% increase in the number of deals during that period. AI companies accounted for nearly one-third (31.4%) of all completed venture deals globally in 2025.
🤖 The Largest AI Funding Rounds of 2025
1. OpenAI — $40B (Valuation: $300B) · ChatGPT creator, transformative AI platform
2. Meta/Scale AI — $14.3B · Meta acquired 49% stake in Scale AI
3. Anthropic — $13B (Valuation: $183B) · Claude AI, safety-focused AI lab
4. xAI — $10B · Elon Musk's Grok AI ($5B equity + $5B debt, July 2025)
5. Databricks — $4B+ (Valuation: $134B) · Data + AI platform, Series L
6. Infinite Reality — $3B (Valuation: $12.25B) · AR/VR + AI convergence (Note: investment later reported as not materializing in Nov 2025)
7. Anduril — $2.5B · Defense AI, Series G
8. Cursor — $2.3B (Valuation: $29.3B) · AI-powered code editor
9. Thinking Machines Lab — $2B · Seed round led by Andreessen Horowitz; valued at $10B
10. Figure AI — $1B+ (Valuation: $39B) · AI-powered humanoid robotics, Series C
SaaS VC Deals By Year
After declining from the pandemic-era peaks, software VC deal count showed signs of recovery in 2025, rising approximately 12% to an estimated 9,200 deals from 8,188 in 2024. While still well below the 2021 peak of 16,446 deals, this marks the first year-over-year increase since 2021.
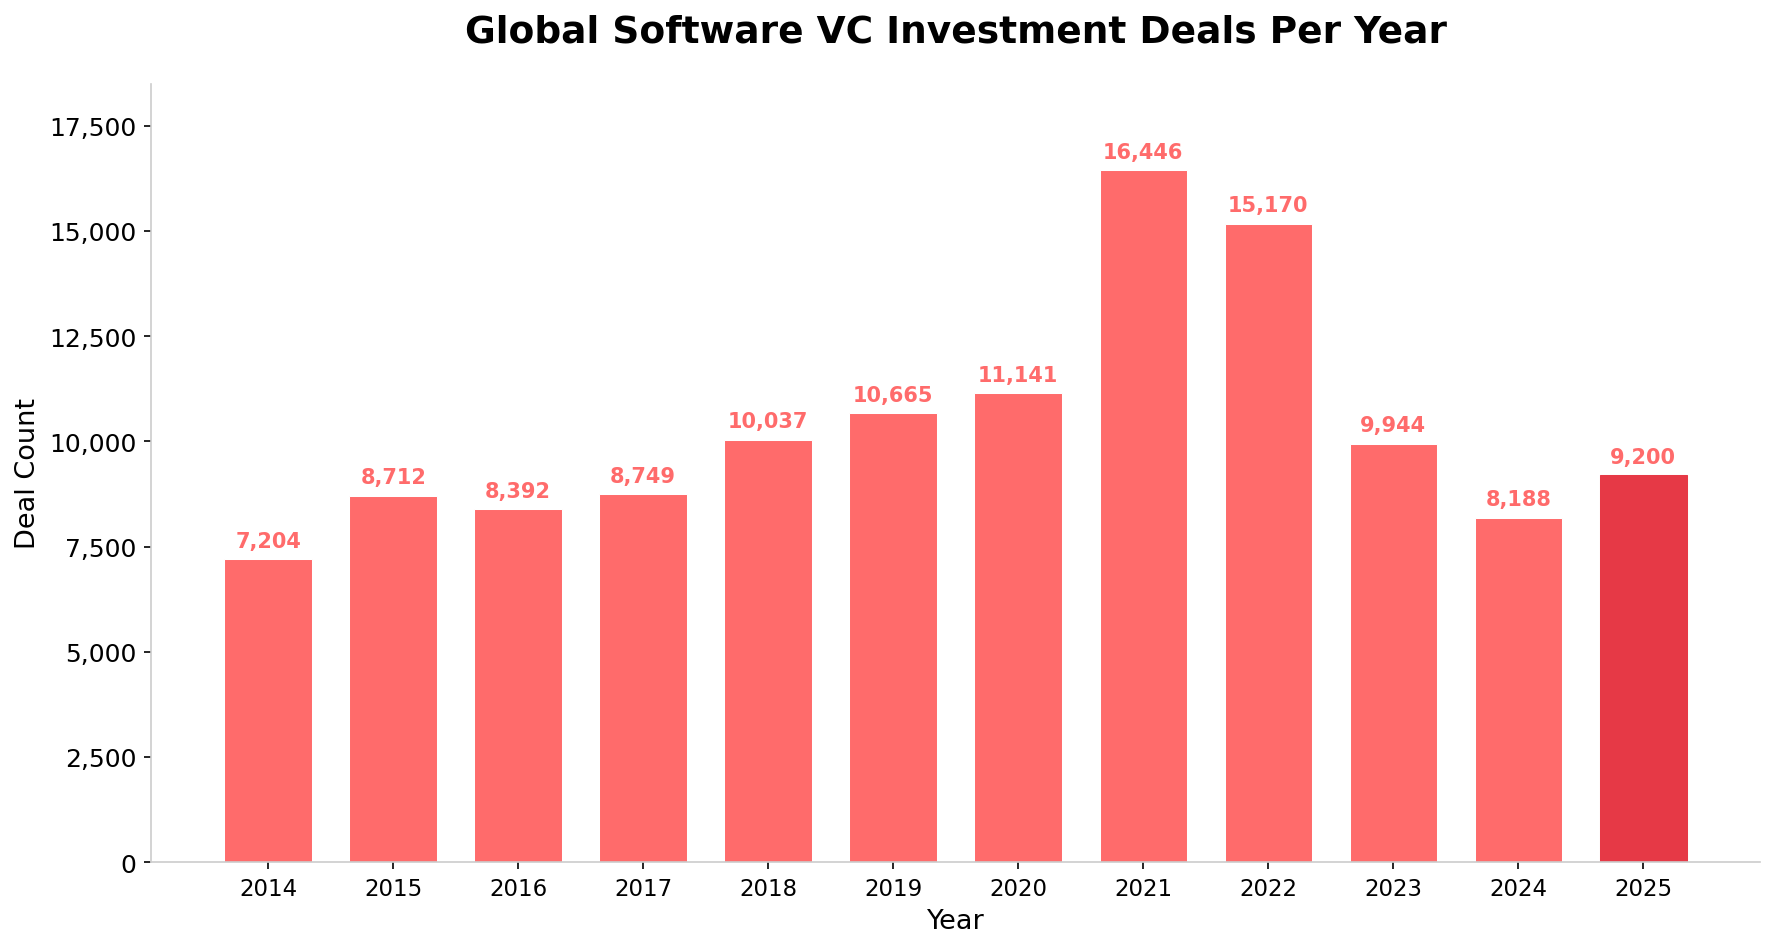
SaaS VC Deals By Year
This recovery was driven primarily by AI-related deals, which accounted for nearly one-third of all completed transactions. First-time financing activity remained low, however, reflecting broader selectivity in the VC market. Investors concentrated capital in proven companies with clear AI narratives, while the long tail of traditional SaaS startups continued to face funding challenges.
The average deal size surged to an estimated $21.7 million, up 42% from $15.3 million in 2024. This continues the trend of fewer deals, but much larger check sizes, as VCs deploy capital into their highest-conviction bets.
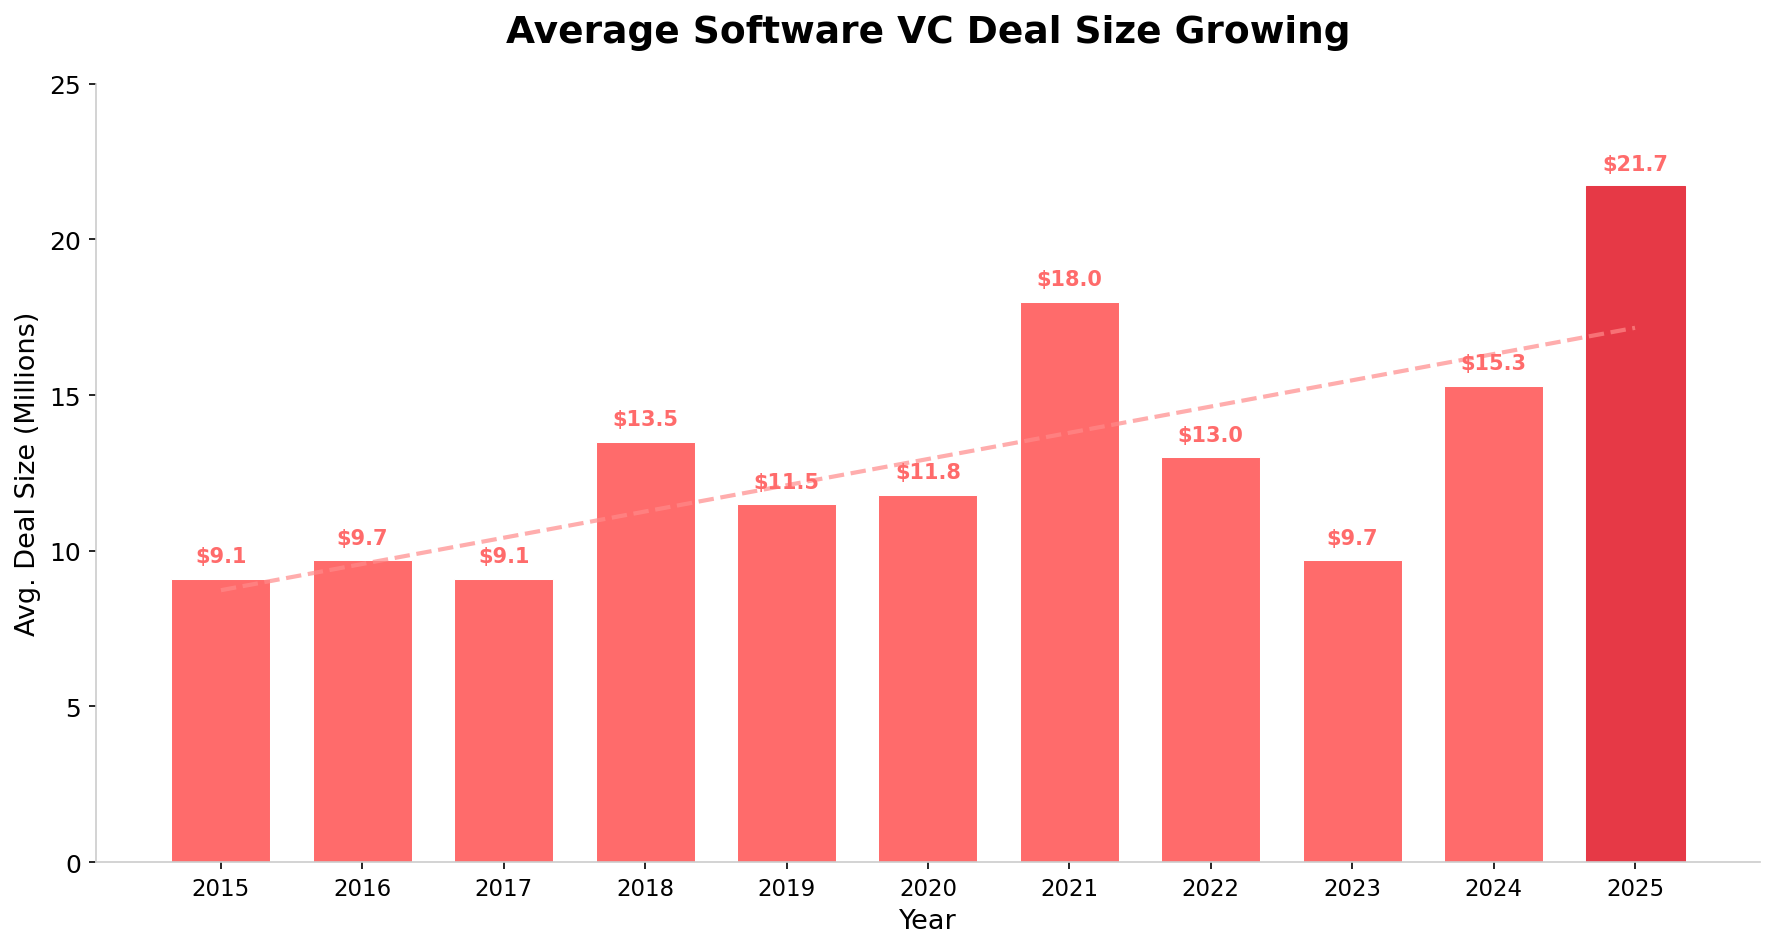
SaaS VC Dollars Invested By Year – Average Investment Size Across All Rounds
SaaS VC Dollars Invested By Year
Total software venture capital invested globally reached an estimated $200 billion in 2025, up 60% from $125 billion in 2024 and the second-highest annual total ever, behind only the $297 billion peak in 2021. The AI investment supercycle drove the majority of this growth.
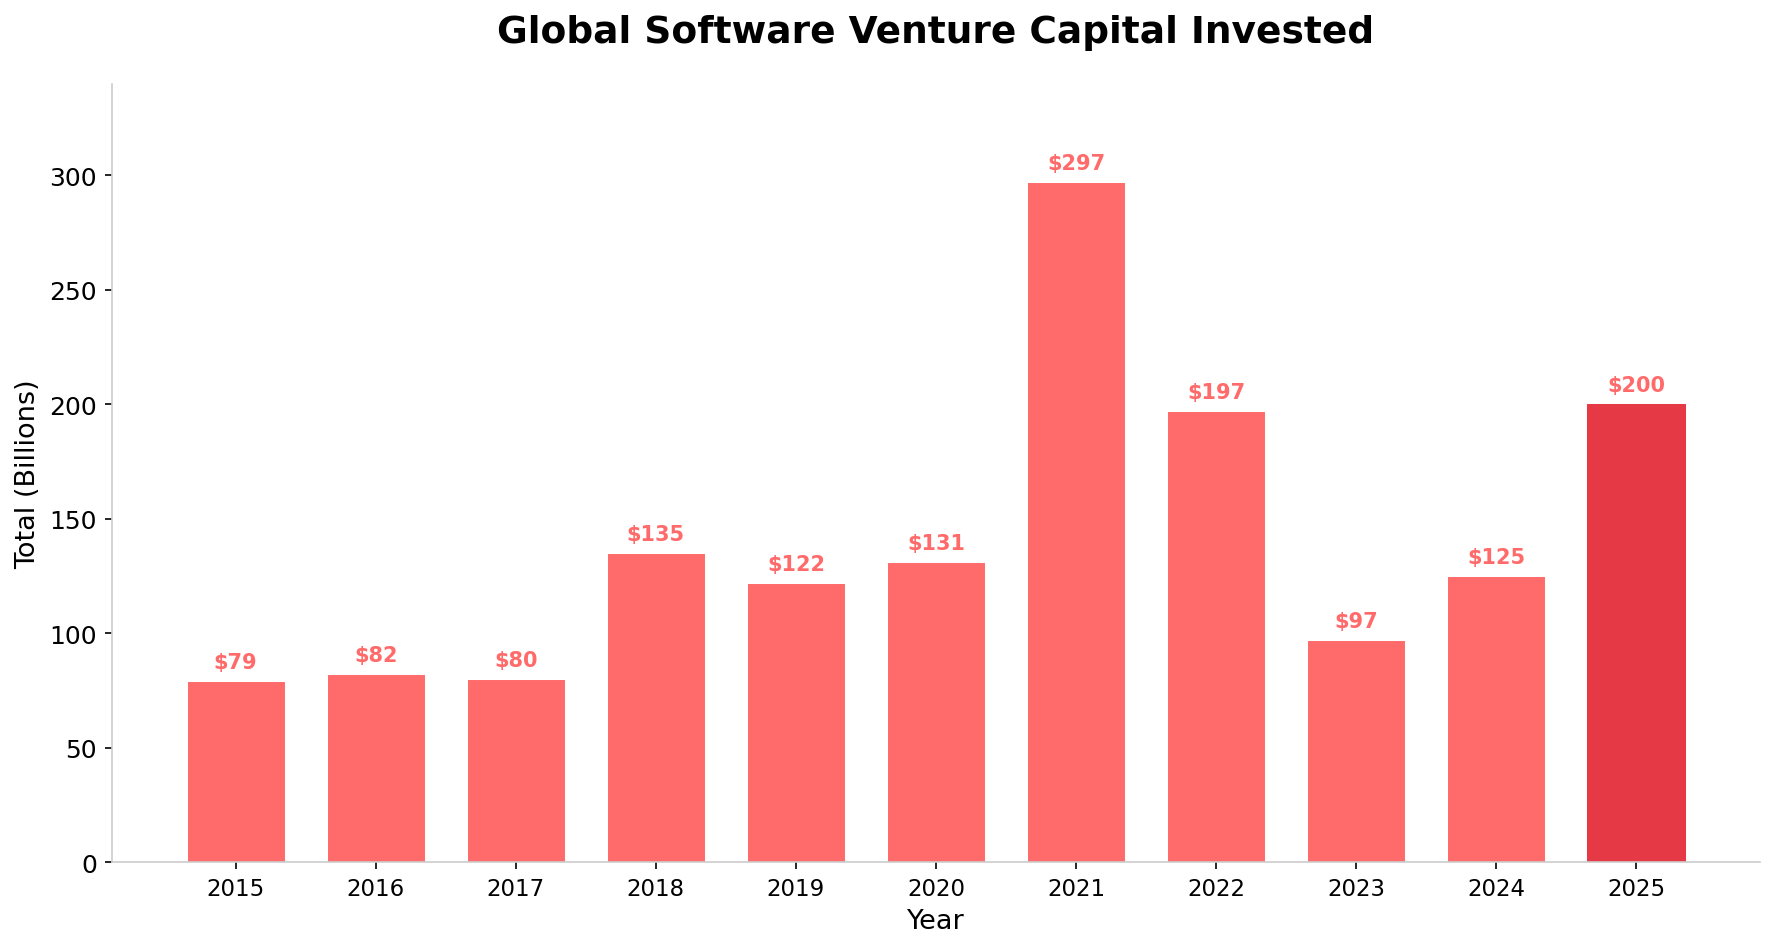
SaaS VC Dollars Invested By Year
While down from the peak of $297 billion in 2021 driven by low interest rates, abundant capital, and pandemic-accelerated digital adoption, software VC investment in 2025 surpassed the 2022 level of $197 billion. The recovery was not evenly distributed, however: AI-related software captured more than half of the total, meaning non-AI software VC investment actually remained relatively flat at roughly $95 billion.
The pattern is clear: capital has bifurcated. A small number of AI-first companies with massive compute requirements and exponential growth trajectories are absorbing the lion's share of new investment, while traditional SaaS companies compete for a shrinking pool of non-AI venture capital. For SaaS founders, the implication is stark — integrating AI into your product strategy has become table stakes for attracting venture investment.
Global Software Venture Capital Invested By Round
Let's see how the money breaks down between Seed, Series A, Series B, Series C, and Series D-E-F+ rounds.
| Year | Seed | Series A | Series B | Series C | Series D/E/F+ | Total (Billions) |
|---|---|---|---|---|---|---|
| 2015 | $5.2 | $19.7 | $11.4 | $13.7 | $29.2 | $79 |
| 2016 | $5.6 | $16.3 | $11.3 | $15.6 | $32.9 | $82 |
| 2017 | $6.9 | $19.2 | $13.1 | $12.9 | $27.4 | $80 |
| 2018 | $9.7 | $26.5 | $14.7 | $33.3 | $50.9 | $135 |
| 2019 | $10.1 | $24.7 | $15.6 | $22.8 | $49.1 | $122 |
| 2020 | $11.7 | $30.1 | $11.6 | $24.5 | $53.0 | $131 |
| 2021 | $22.0 | $54.2 | $32.7 | $64.7 | $123.2 | $297 |
| 2022 | $28.5 | $49.7 | $21.8 | $38.2 | $58.5 | $197 |
| 2023 | $17.9 | $24.8 | $9.8 | $17.3 | $27.0 | $97 |
| 2024 | $15.7 | $26.4 | $17.6 | $30.0 | $35.4 | $125 |
| 2025 | $17.5 | $35.0 | $24.5 | $38.0 | $85.0 | $200 |
| Totals (Billions) | $150.8 | $326.6 | $184.2 | $311.0 | $571.6 | $1,545 |
SaaS VC Dollars Invested By Year By Round
The most striking change in 2025 was the explosion in Series D/E/F+ investment, which surged to an estimated $85 billion — up 140% from $35.4 billion in 2024. This was driven almost entirely by AI mega-rounds (OpenAI, Anthropic, xAI, Databricks, etc.) that fell into later-stage categories. Early-stage (Seed + Series A) investment grew a healthy 22% to $52.5 billion, signaling that early-stage AI investing remained robust.
How Software Valuations Have Changed
Venture valuations for software firms continued their post-2023 recovery in 2025, with AI-powered companies commanding significant premiums. However, the recovery was uneven — AI startups saw valuations soar while traditional SaaS faced more disciplined pricing.
Here are the median pre-money valuations per round over the last twelve years for Series A, B, and C software startups.
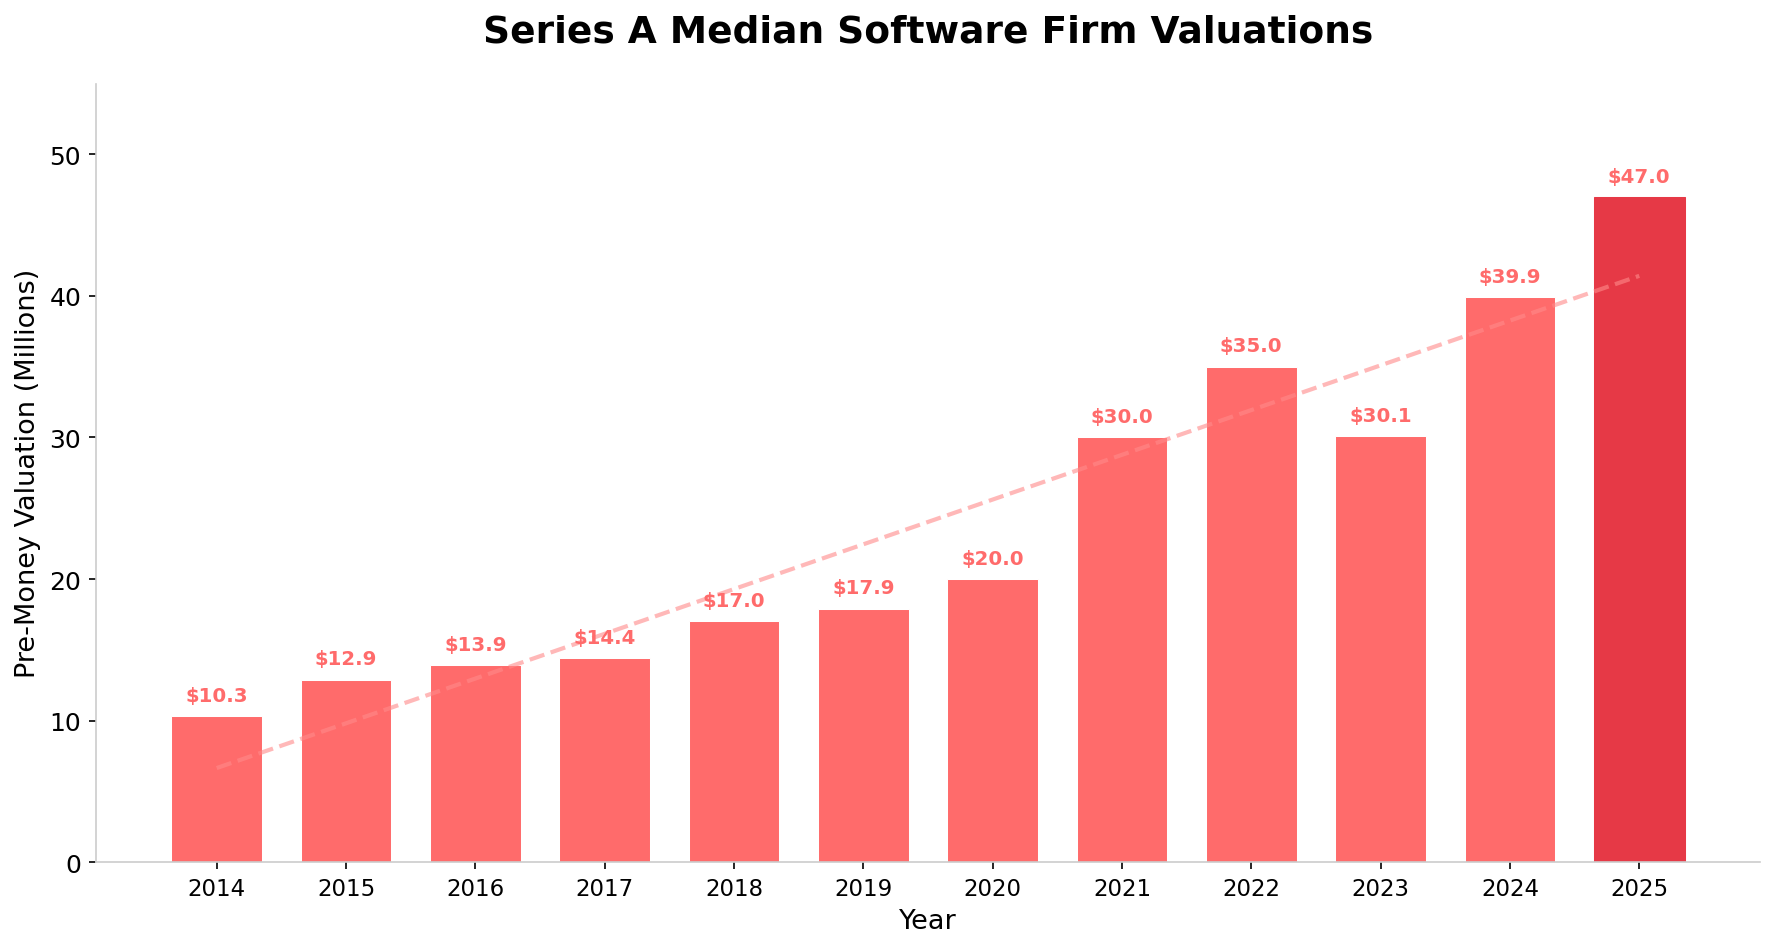
SaaS Valuations By Round By Year
Series A median pre-money valuations reached a new all-time high of $47.0 million in 2025, up 18% from the previous record of $39.9 million in 2024. The AI boom has been the primary driver — early-stage AI companies with strong technical teams and product-market fit are commanding premium valuations, with some AI-native startups receiving $60-80M+ pre-money valuations at Series A. Average Series A valuations (which include outliers) jumped to $25.3 million from $20.3 million, a 25% increase per PitchBook data.
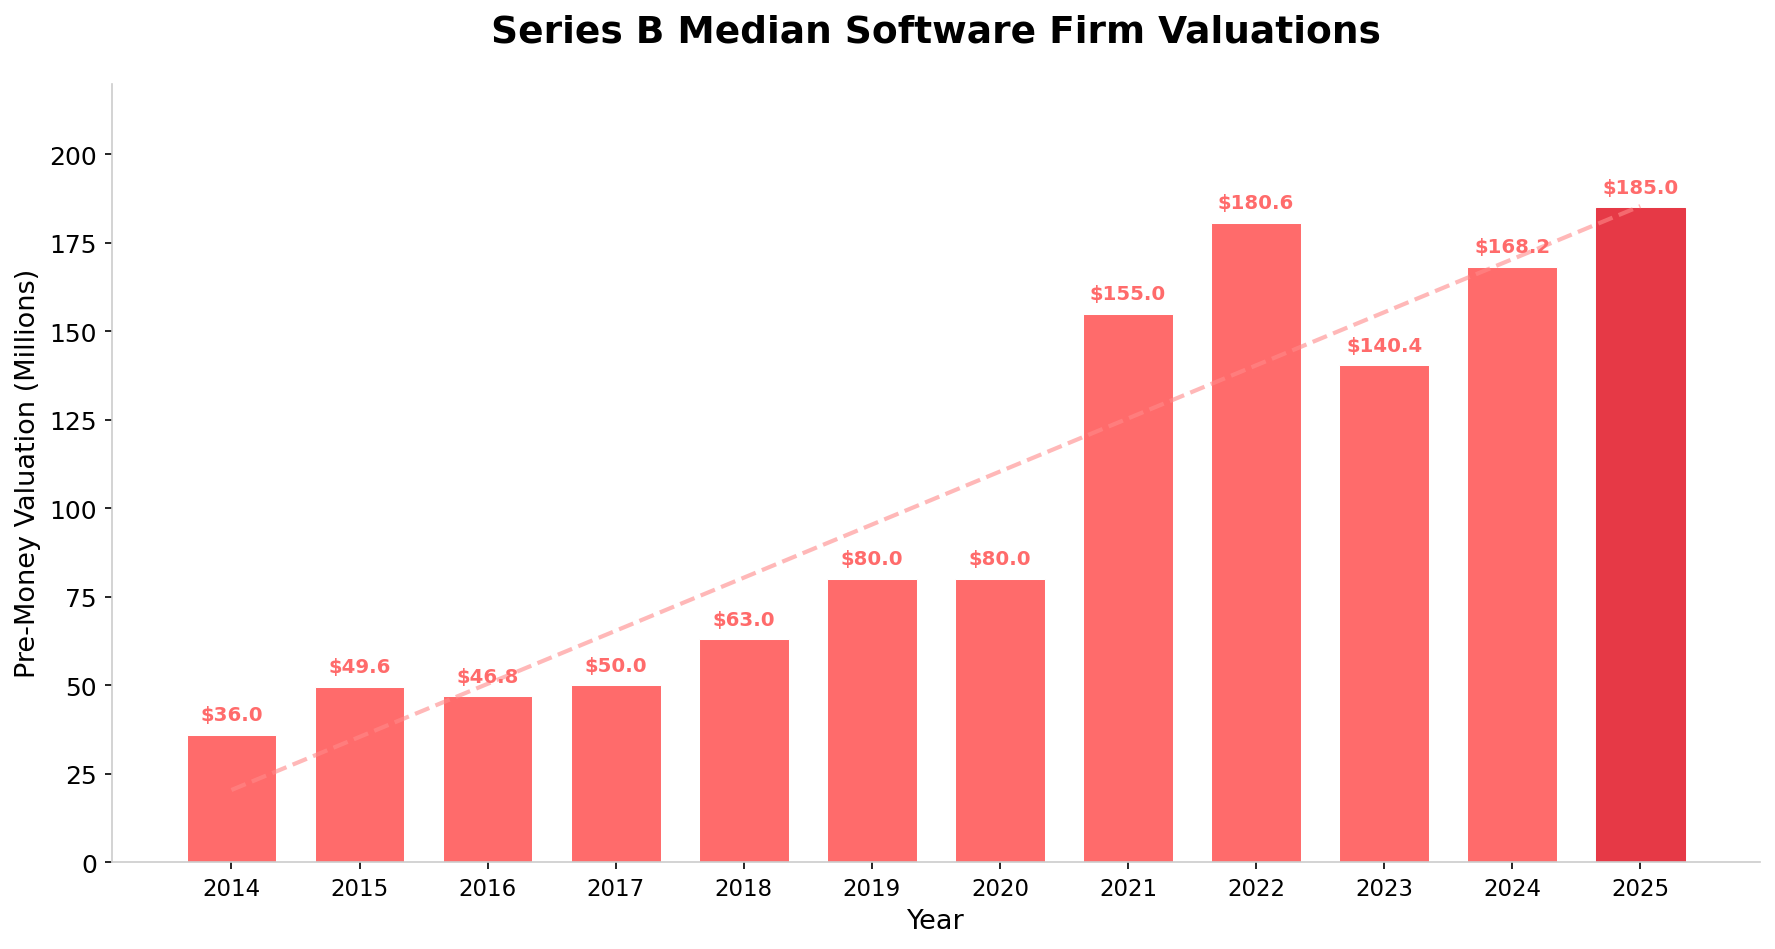
SaaS Valuations By Round By Year
Series B median pre-money valuations rose to an estimated $185.0 million in 2025, up 10% from $168.2 million in 2024. The growth was more moderate than at Series A, reflecting investor caution at this stage. Interestingly, average Series B valuations actually declined slightly to $56.9M from $59.3M (PitchBook data), suggesting a barbell effect: a few AI companies commanding massive valuations while the broader market was flat or down.
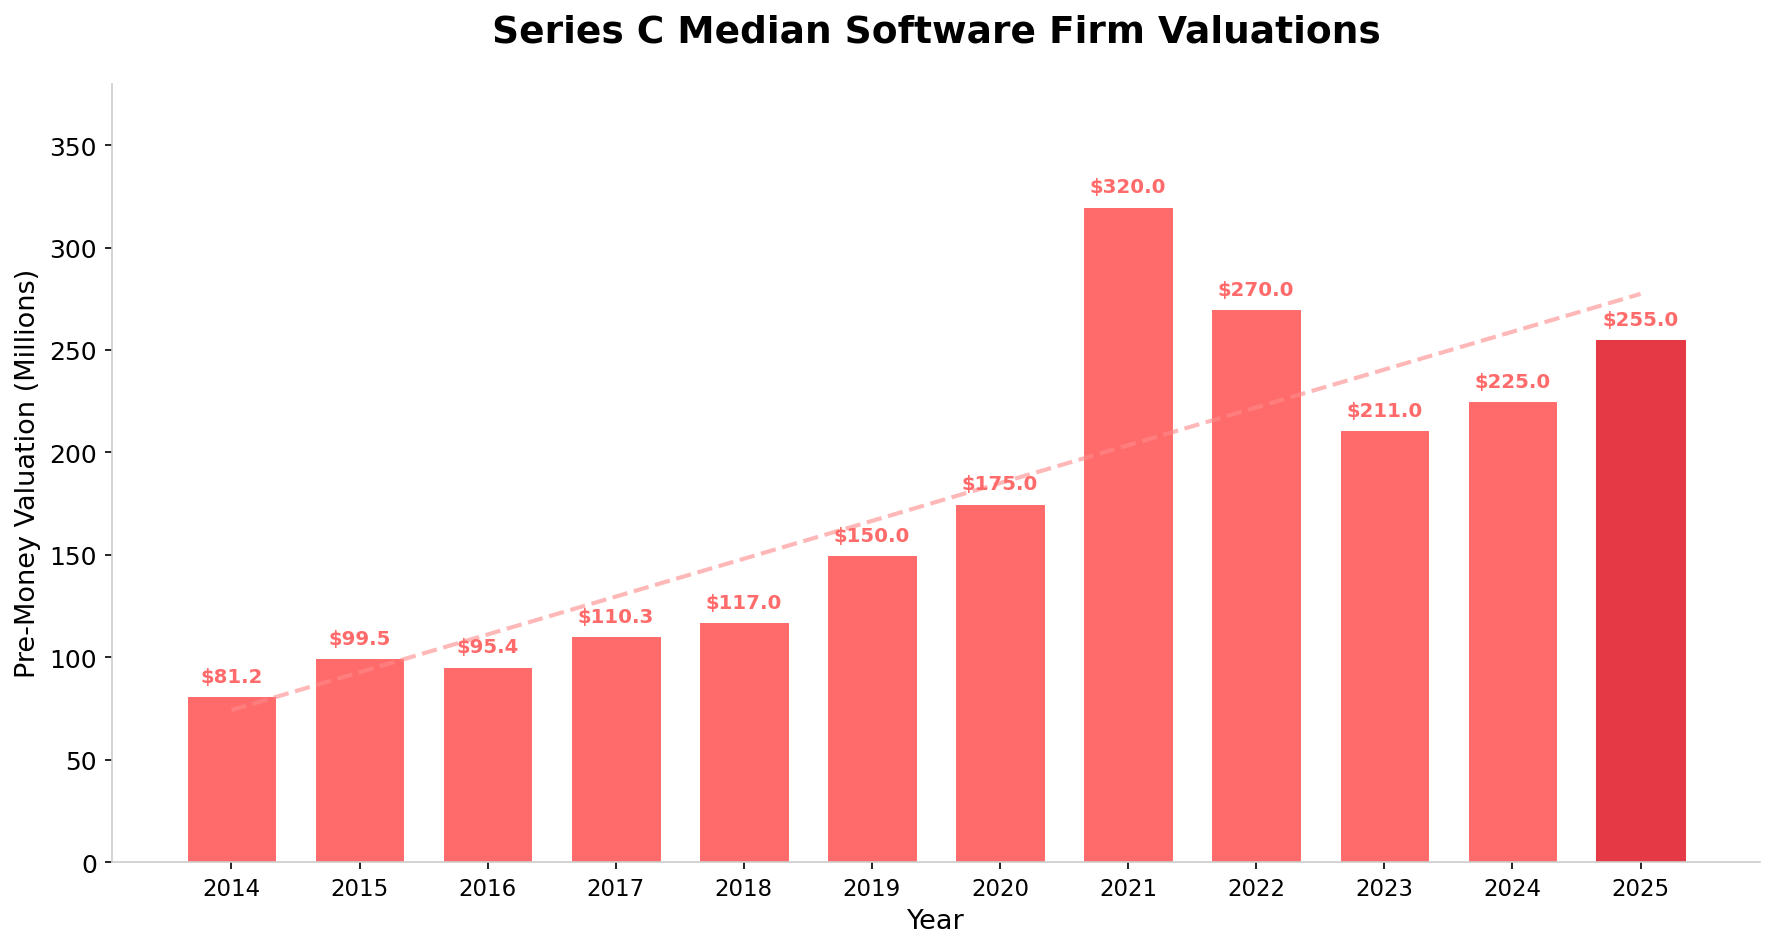
SaaS Valuations By Round By Year
Series C median pre-money valuations recovered to an estimated $255.0 million in 2025, up 13% from $225.0 million in 2024 but still well below the $320 million peak in 2021. Late-stage investors remain more disciplined than during the zero-interest-rate era, demanding clearer paths to profitability and exits. The most dramatic shift was at Series D+, where average valuations exploded to $460.1 million from $213.4 million, driven entirely by AI mega-rounds.
SaaS VC Deal Valuations By Round By Year
| Series A Deals | Series B Deals | Series C Deals | ||||||
|---|---|---|---|---|---|---|---|---|
| Year | Amount | Valuation | Amount | Valuation | % Sold | Amount | Valuation | % Sold |
| 2025 | $13.5 | $47.0 | $32.0 | $185.0 | 14.7% | $42.0 | $255.0 | 14.1% |
| 2024 | $12.0 | $39.9 | $30.0 | $168.2 | 15.1% | $35.0 | $225.0 | 13.5% |
| 2023 | $10.4 | $30.1 | $28.5 | $140.4 | 16.9% | $30.0 | $211.0 | 12.4% |
| 2022 | $11.4 | $35.0 | $34.0 | $180.6 | 15.8% | $50.0 | $270.0 | 15.6% |
| 2021 | $10.0 | $30.0 | $30.9 | $155.0 | 16.6% | $50.0 | $320.0 | 13.5% |
| 2020 | $7.0 | $20.0 | $20.0 | $80.0 | 20.0% | $30.8 | $175.0 | 15.0% |
| 2019 | $6.6 | $17.9 | $20.0 | $80.0 | 20.0% | $30.0 | $150.0 | 16.7% |
| 2018 | $6.3 | $17.0 | $16.0 | $63.0 | 20.3% | $25.8 | $117.0 | 18.1% |
| 2017 | $5.2 | $14.4 | $15.0 | $50.0 | 23.1% | $25.0 | $110.3 | 18.5% |
| 2016 | $4.8 | $13.9 | $14.7 | $46.8 | 23.9% | $26.0 | $95.4 | 21.4% |
| 2015 | $4.7 | $12.9 | $15.0 | $49.6 | 23.2% | $21.0 | $99.5 | 17.4% |
| 2014 | $3.6 | $10.3 | $11.0 | $36.0 | 23.4% | $17.0 | $81.2 | 17.3% |
SaaS Valuations By Round By Year
The percentage of shares sold in venture deals has continued its long-term decline. In 2025, Series A founders sold approximately 22.3% of their company (down from 25.8% in 2014), Series B founders sold 14.7% (down from 23.4% in 2014), and Series C founders sold 14.1% (down from 17.3% in 2014). This trend reflects the increasing leverage founders have in negotiations, particularly for AI-first companies.
SaaS VC Deal Revenue Multiples
Because of the compelling business model of SaaS (recurring revenue annuity streams), SaaS firms continue to command higher revenue multiples than most industries. For venture-backed SaaS companies growing at 50-200%+ annually, revenue multiples remain elevated relative to the broader market.
In 2025, the median revenue multiple for venture-backed SaaS companies was approximately 10.8x ARR, up from 10.1x in 2024. However, there's a critical nuance: AI-powered SaaS companies typically commanded 14-20x+ revenue multiples, while traditional SaaS companies without an AI narrative saw multiples compress to 6-8x.
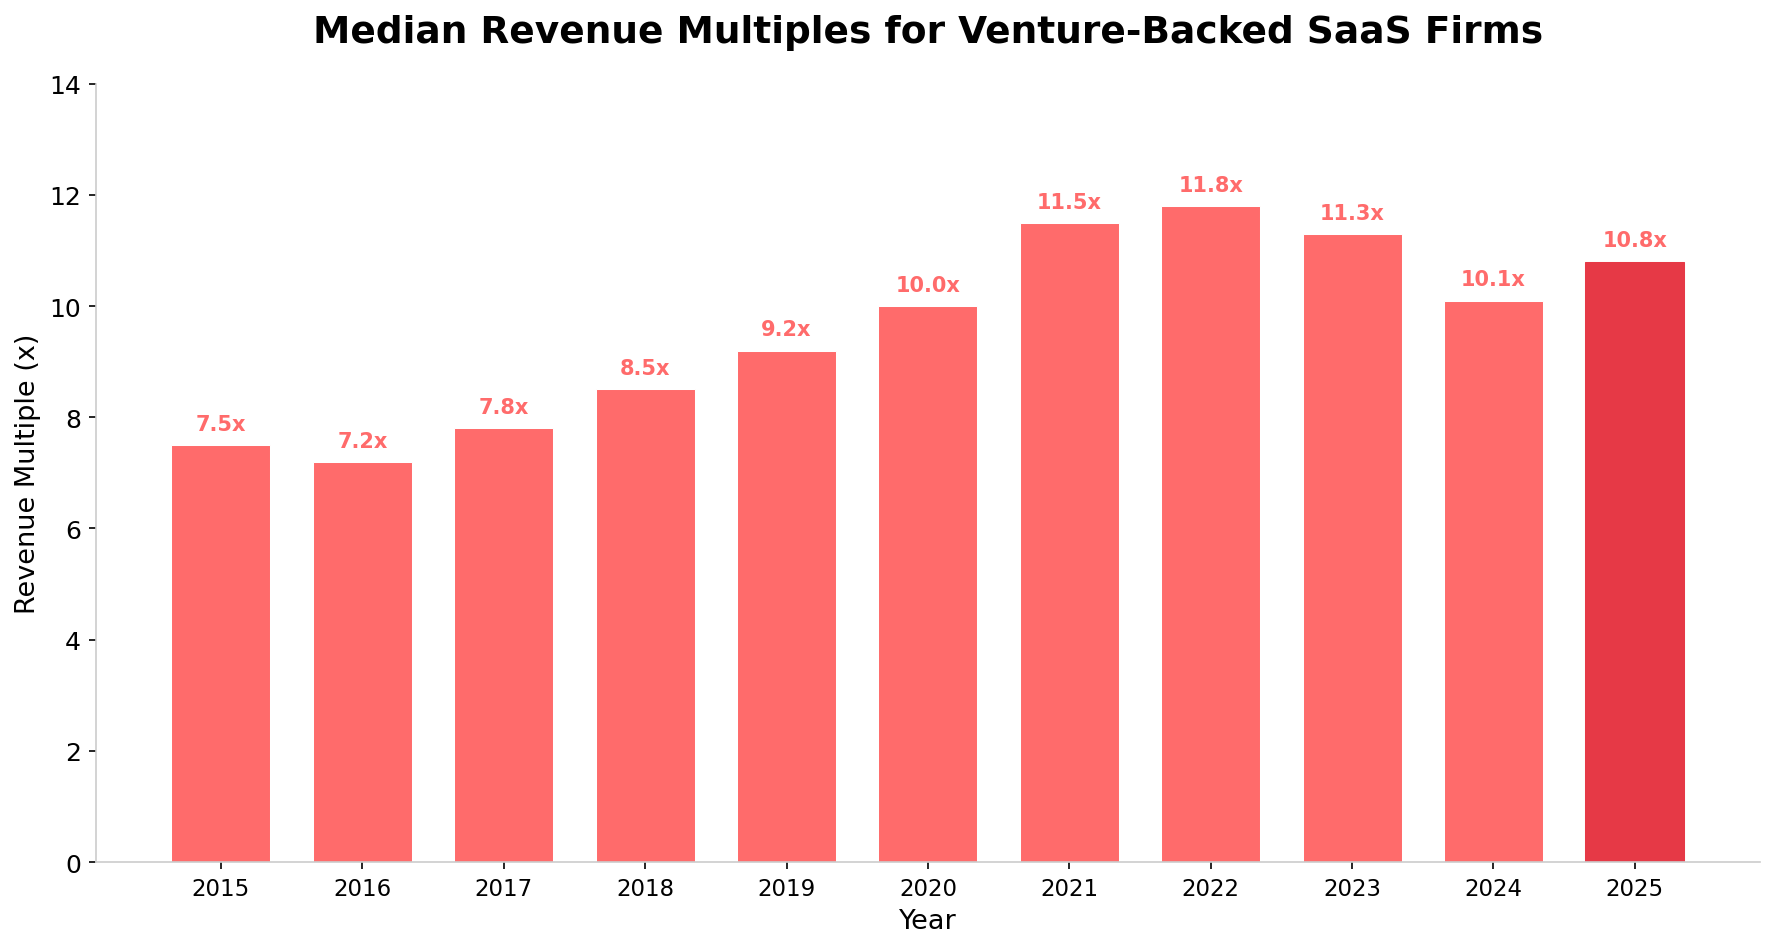
SaaS Revenue Multiples
Revenue multiples peaked in 2022 at 11.8x before settling back to 10.1x in 2024. The 2025 recovery to 10.8x was almost entirely driven by AI-native companies being included in the dataset. For non-AI SaaS, multiples likely remained flat or slightly declined.
Revenue Multiples by Growth Rate
Growth rate remains the single most important driver of revenue multiples for venture-backed SaaS firms. The Rule of 40 has also become increasingly important, with each 10-point improvement linked to approximately a 1.1x increase in EV/Revenue multiples (up from 0.8x in early 2025).
| Annual Revenue Growth Rate | Median Revenue Multiple (2025) | Change from 2024 |
|---|---|---|
| <20% (Low Growth) | 4.5x | -0.5x |
| 20–40% | 7.2x | -0.3x |
| 40–60% | 9.8x | +0.2x |
| 60–80% | 12.5x | +0.5x |
| 80–100% | 15.0x | +1.0x |
| >100% (Hyper Growth) | 20.0x+ | +2.0x+ |
SaaS VC Deal Revenue Multiples by Growth Rate
The spread between high-growth and low-growth SaaS companies has widened significantly. Companies growing at 100%+ can command 20x+ revenue multiples (especially if AI-native), while companies growing below 20% are seeing multiples compress below 5x — a dynamic the market has dubbed the "SaaSpocalypse" for traditional, slow-growth SaaS.
Public SaaS Multiples Under Pressure
While private venture-backed SaaS valuations held up reasonably well in 2025 (boosted by AI), the public SaaS market told a very different story. Public SaaS multiples declined sharply throughout 2025, driven by fears of AI disruption, slowing revenue growth, and a rotation toward profitability metrics.
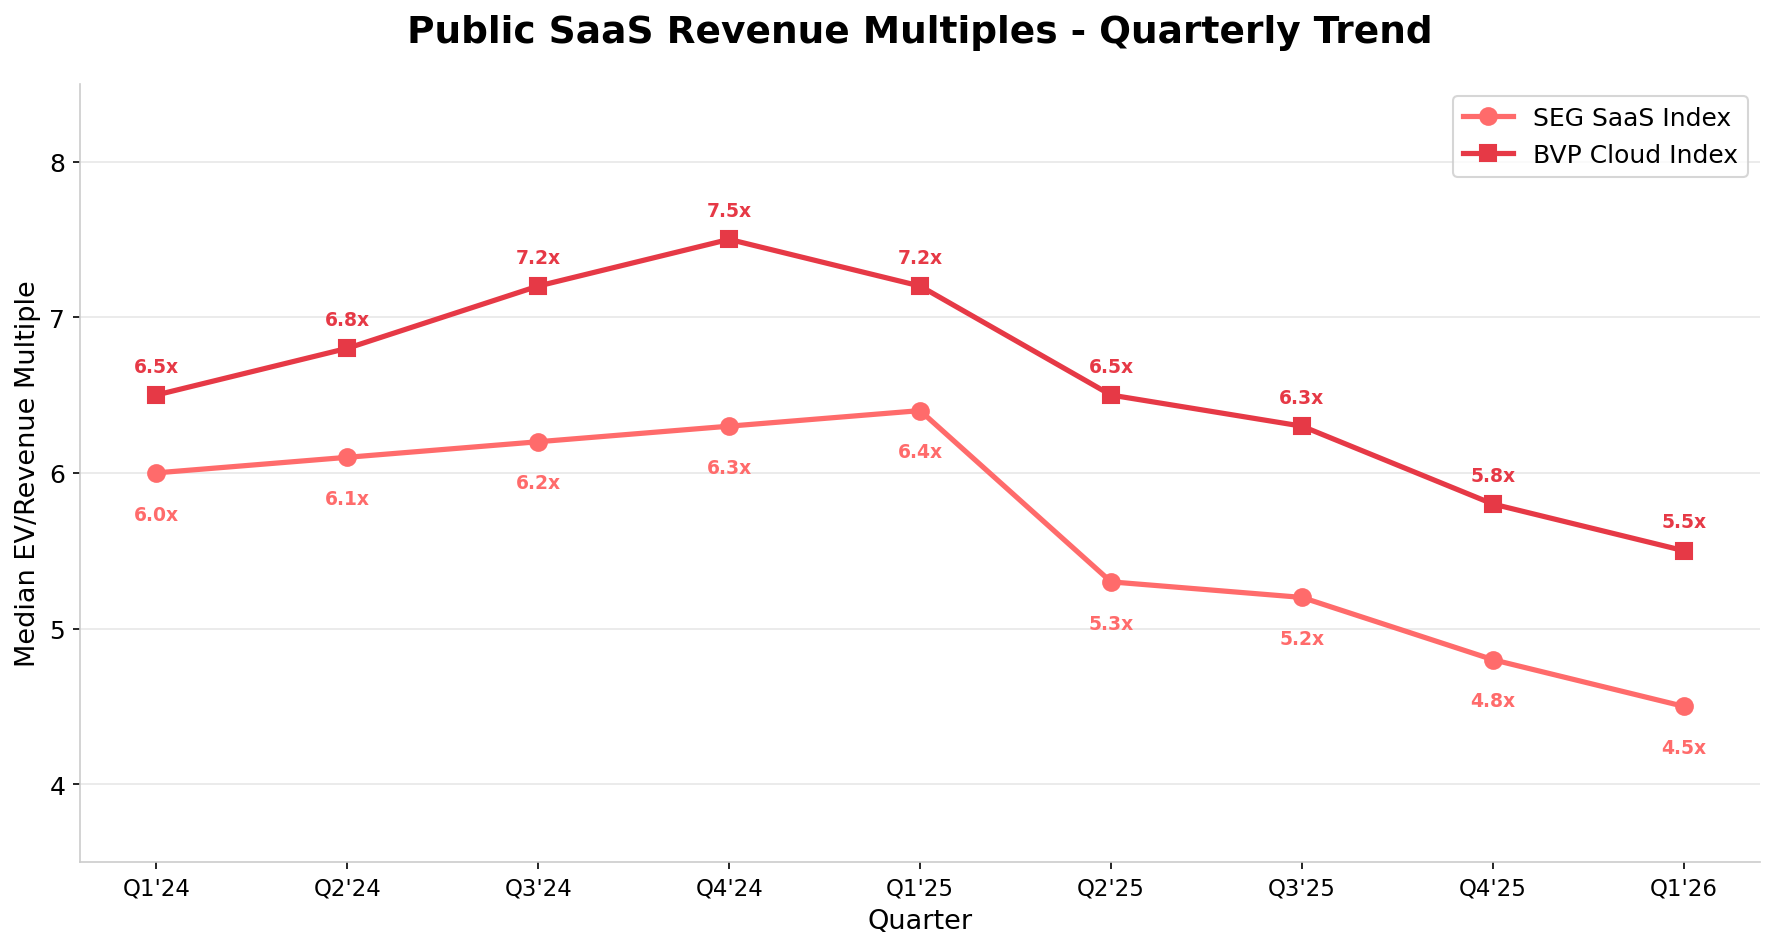
Public SaaS Revenue Multiples – Quarterly Trend (SEG SaaS Index & BVP Cloud Index)
Key public SaaS valuation data points:
- The SEG SaaS Index declined from 6.3x EV/Revenue (Q4 2024) to 4.8x (Q4 2025) — a 24% decline in just one year
- The BVP Nasdaq Emerging Cloud Index average revenue multiple stood at 5.8x with average growth of 18.6%
- Per Aventis Advisors, the median EV/Revenue multiple for public SaaS fell to 3.4x as of March 2026 — the lowest since tracking began in 2015
- B2B SaaS revenue multiples contracted from 6.7x in 2024 to 5.9x in 2025 (Finerva/SEG data)
- Profitable SaaS companies traded at 7.8x revenue vs. 6.7x for unprofitable peers — profitability now commands a clear premium
- EV/EBITDA is rapidly becoming the dominant valuation metric for SaaS for the first time, with the sector trading at ~26.6x EBITDA
- For the first time since tracking began, US SaaS companies no longer trade at a premium to global SaaS
⚠️ The SaaSpocalypse and AI Disruption
The most significant theme impacting public SaaS valuations in late 2025 and early 2026 has been the fear of AI disruption. Investors are increasingly questioning whether traditional SaaS business models — based on per-seat licensing and workflow automation — will survive the rise of AI agents that can replace entire categories of software. This has led to a broad repricing of the entire SaaS sector, with median revenue growth falling to 12.2% by Q4 2025. Companies with clear AI integration stories have been rewarded; those without face existential questions from investors.
What Revenue Multiple to Expect For Your SaaS Firm
Based on current market data, here is a realistic framework for SaaS company valuations:
| Company Profile | Expected Revenue Multiple (2026) |
|---|---|
| Public SaaS – Median (157 companies, Jan 2026) | 4.0x median / 6.6x average |
| Private VC-Backed SaaS (Series A-C) | 5.3x median / 8.0-10.0x top quartile |
| High-Growth SaaS (>40% growth, >120% NRR) | 10.0x – 15.0x |
| AI-Native SaaS (>100% growth) | 15.0x – 25.0x+ |
| Traditional SaaS (<20% growth) | 2.0x – 5.0x |
| SaaS with NRR < 90% | 1.0x – 2.5x |
| SaaS with NRR > 120% | 10.0x+ |